Are you generating content but unsure if it’s effective? Do you hear crickets when you post on social media?
TL;DR - Click here to Watch the Videos BelowTo build your business, you must first understand what is working. Most business owners struggle to comprehend Google Analytics, which will with a bit of understanding, help you enhance your website’s rating and grow your business online. You can read more about the Google Analytics beginner’s guide I created here.
Google Analytics reports are essential tools for everything we do online nowadays, especially for business owners. They will assist you in gaining insight into areas like your website’s performance, where your visitors originate from, and the number of target conversions specific pages creates. This information will serve as a good basis for knowing how to improve your website.
Here are the six most important Google Analytics reports for improving your website.
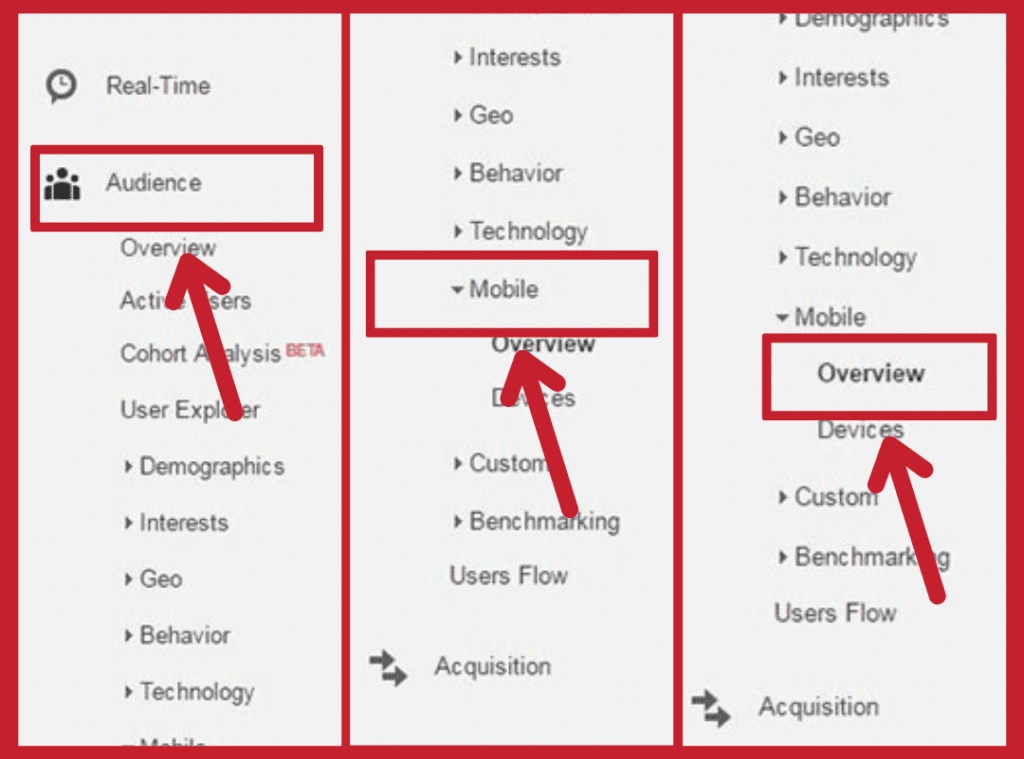
Mobile Overview Report
 Nowadays, almost everyone uses a mobile device to look for reliable information or purchase things; if the website is slow or difficult to use, people will go elsewhere. Mobile devices accounted for 59.4% of total online traffic as of August 2022. The Mobile Overview Report is a critical Google Analytics report that assists website owners in identifying mobile site pain points. People will not stay to learn about your company or items if your website is not mobile-friendly.
If Google discovers your website is not mobile-friendly, it will punish you by lowering your ranking. Google Analytics offers you the option to monitor what sort of device users are using to access your mobile site, as well as what channel they’re arriving from, which is another fascinating part of this report. The mobile overview report will highlight chances for mobile optimisation that might cause higher traffic and ranking.
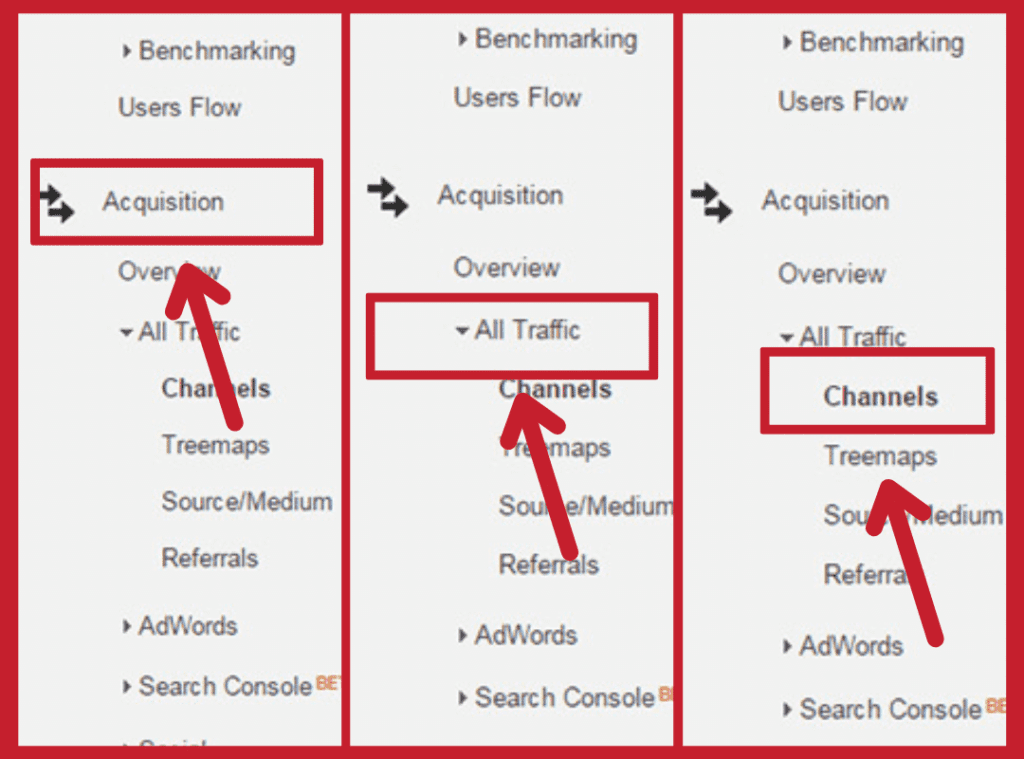
Channels Report
 With the information in this report, you can determine how much of your website’s traffic comes from certain sponsored or unpaid sources, including social media. Using goal tracking, you can find out how many visitors you had, how long they stayed on your website, and if you could convert them into clients. Knowing these numbers is crucial since it will help your business know which channels to optimise. You’ll know where to make changes if traffic is down or the bounce rate is higher than it was last year, etc.
Under the Channel reports, here are some of the common groupings you will find:
- Organic Search – perfect if you’re working on optimising pages for search engines.
- Paid Search – you generate this traffic through paid search ads.
- Social – people find your page through a linked social media account is the source of this traffic.
Navigation Summary
 You can see from this overview the most popular paths people take to reach specific URLs on your website. You may define the dates you want to use and the URLs you want to investigate. The ability to track visitors’ origin and destination after they have browsed your site is another interesting feature of this report.
This data is helpful for a variety of reasons. You’ll notice patterns of what visitors care about your website. By optimising paths and pages and adding shortcuts, you can make your workflow easier. Using this report will also give us a better idea of what questions your potential clients have. For example, if they’re clicking back and forth between pages. They might have questions that your content doesn’t address.
Make sure they don’t land on a competitor’s page when searching for answers by optimising these pages.
Landing Pages Report
 The Google Analytics Landing Pages report is great for obtaining critical information about your website traffic and examining how customers engage with your landing pages. This report shows you which pages visitors see first when they arrive at your website and whether those visits result in clicks and conversions.
What are the most important metrics in the landing page report?
- Bounce Rate – user exit rates after arriving at a landing page and not interacting with the rest of your site.
- New User – the percentage of visitors to your landing page who have never used your website before.
- Average session duration – how long customers spend on your website in a single session, on average.
The Google Analytics Landing Pages report is great for obtaining critical information about your website traffic Share on X
Site Speed Overview Report
 The importance of site performance is our extreme impatience in the digital age. We now take online browsing for granted and expect responses almost instantly. When a website takes more than a few seconds to load, the bounce rate drastically rises, according to several studies, including Neil Patel’s blog. It implies that you can lose out on conversions from visitors who leave before ever getting to know you and what you offer.
So, how can you check your website speed?
If your website uses Google Analytics monitoring, you may check your site’s performance using the Site Speed Overview Report. You may check the average load times for pages and browsers while viewing this data. Because you can identify which browsers could require improvement, this information is helpful. Your website has a higher chance of converting visitors into customers the faster it loads.
Using the Site Speed – Speed Suggestions report and going through to PageSpeed Insights, Google Analytics provides advice on how to speed up your site. Although, you don’t have to follow all of Google’s recommendations. Some recommendations may go against how you want your website to operate, but you should always examine the tradeoffs with site performance.
Goal Overview Report
 The Goal Overview report is undoubtedly Google Analytics’ most significant report. You may track particular interactions as objectives, such as form submissions and downloads. When a user converts, your business has a qualified lead who is more likely to make a purchase.
You may choose time frames to be analysed for in this report and discover which sites are generating conversions and from which channels they are originating. The capability to contrast current data with previous data is one of these modifications. This report makes it simpler to determine whether business objectives are being accomplished and whether any areas may be improved.
Conclusion
In today’s technology world, these critical Google Analytics reports are essential tools. They will assist you in learning about your mobile website’s performance, where your users are coming from, and how many target conversions various pages are producing. All of this knowledge will provide you with a solid foundation for understanding how to improve your website.
My entire business & agency, Marketing Leap, runs on Google. And after nearly 9 years of being a Google Specialist & Partner, growing your business using Google’s free tools is a passion of mine.
Whether you have any questions or simply want to chat, drop a comment below! We offer a full range of done for you realistic, practical marketing solutions for your business that deliver results and hit the spot with your customers. You can check out what we do here.
Don’t forget to Check out our library of FREE Resources & Downloads to help you grow your business!
If you want to learn how to implement different marketing elements in your own business, I have a series of Online Digital Success courses focusing on different marketing elements. These are self-paced courses, so you don’t miss out on the learning! You can learn all about those here.
Prefer structured mentoring? I also offer a 12-week 1to1 mentoring program designed to Give You Clarity, Generate leads & STOP DROWNING IN THE OVERWHELM! There are also 2 hours Strategy Sessions available. If it’s time to get a Clear Action Plan, Digital Strategy Map & Checklists, you can check out the details here!
Regardless of what you need when it comes to online marketing, take the Leap … we are your springboard to success!
FAQs To Know About Google Analytics Reports
- Mobile Overview Report
- Channels Report
- Navigation Summary
- landing Page Report
- Site Speed Overview Report
- Goal Overview Report
- Organic Search – perfect if you’re working on optimising pages for search engines.
- Paid Search – you generate this traffic through paid search ads.
- Social – people find your page through a linked social media account is the source of this traffic.
- Bounce Rate – user exit rates after arriving at a landing page and not interacting with the rest of your site.
- New User – the percentage of visitors to your landing page who have never used your website before.
- Average session duration – how long customers spend on your website in a single session, on average.


